

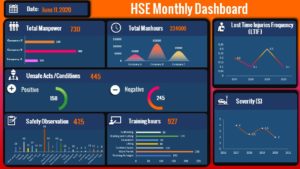
HSE Project Dashboards
Dashboard – A type of graphical user interface which often provides at-a-glance
views of key performance indicators (KPIs) relevant to a particular objective or business process.
If it’s a place to go that will illustrate how well we’re doing on the project for meeting our goals,
is easily distributed and it’s current, then it sounds like something that would solve a number of
issues on our projects.
So why don’t we have one?
Projects typically don’t utilize dashboards because they require a streamlined, well defined
workflow process in the background to supply data in a suitable format. Displaying stale
historical data doesn’t benefit anyone, and the dashboard is discarded. It’s the old story of
“Garbage in, Garbage Out”
But if that same dashboard is coupled to a robust information process that surfaces current
data to stakeholders, they quickly increase in value.
Before the bar chart flashes across the screen and the latest stats appear, there are a number
of steps that must happen. We have to start in the planning stages to list the desired
elements that we want to illustrate such as reports, KPI’s, trends, etc. Who will our viewers be?
What information will they want to monitor?
Once we decide what we’ll be displaying, we must work backwards to determine where we
will get the information from in our system. Will we need to look at several standalone items
and display totals? Will we need a summary of items from different locations/jobs? Where does
this information reside and how is it generated? Daily? Monthly? Externally? Internally?
There are programs in use on projects that will easily summarize data and display it on a
dashboard, however, they are rare if they will allow integration with other programs. An
example would be when the LEM’s are based in an Excel formatted spreadsheet and the H&S
program has all the safety documentation. Trying to build a live dashboard that pulls
information into a graph by using both systems is difficult and soon dismissed.
How do you build an automated system that surfaces data from multiple sources?
You start from the basics, which is the development of forms that contain mandatory fields to capture
the required data, you then automate the export of the forms to a platform that will sort and
compile the data, then you connect it to the dashboard for display. Easy right?
By designing the input requirements and workflows prior to the project, customizable
dashboards are easily created, and the value is quickly realized as the project gains momentum.
Dashboards can be developed at each level of the H&S system or across multiple levels of a
project, from subcontractor up to the owner, and are easily shared throughout stakeholders.

0 Comments